Ed. Note: Three-day migration forecasts on BirdCast will resume on 1 August, just in time for the start of the fall migration season.
Weather radar stations across the continental United States may have predicted “April showers” for some this spring, but for the first time, new maps used radar to forecast and track in near-real time the passage of nocturnally migrating birds.
Researchers at the Cornell Lab of Ornithology and the University of Oxford made a breakthrough nearly 20 years in the making—processing weather radar data to produce maps that visualize migration on the Cornell Lab’s BirdCast website. The site has two powerful new features: a three-night migration forecast for the entire continental United States, and a live migration map for the same region.
The migration forecasts give a quick glance at what to expect each night for the next three nights, with predictions based on models that combine weather data and radar data. These forecasts are updated daily, affording birders the opportunity to plan when to visit migration traps looking for new arrivals, providing municipalities information about when to extinguish lights to reduce collision hazards, and facilitating the energy industry with decision-support to mitigate potential hazards posed by operations.
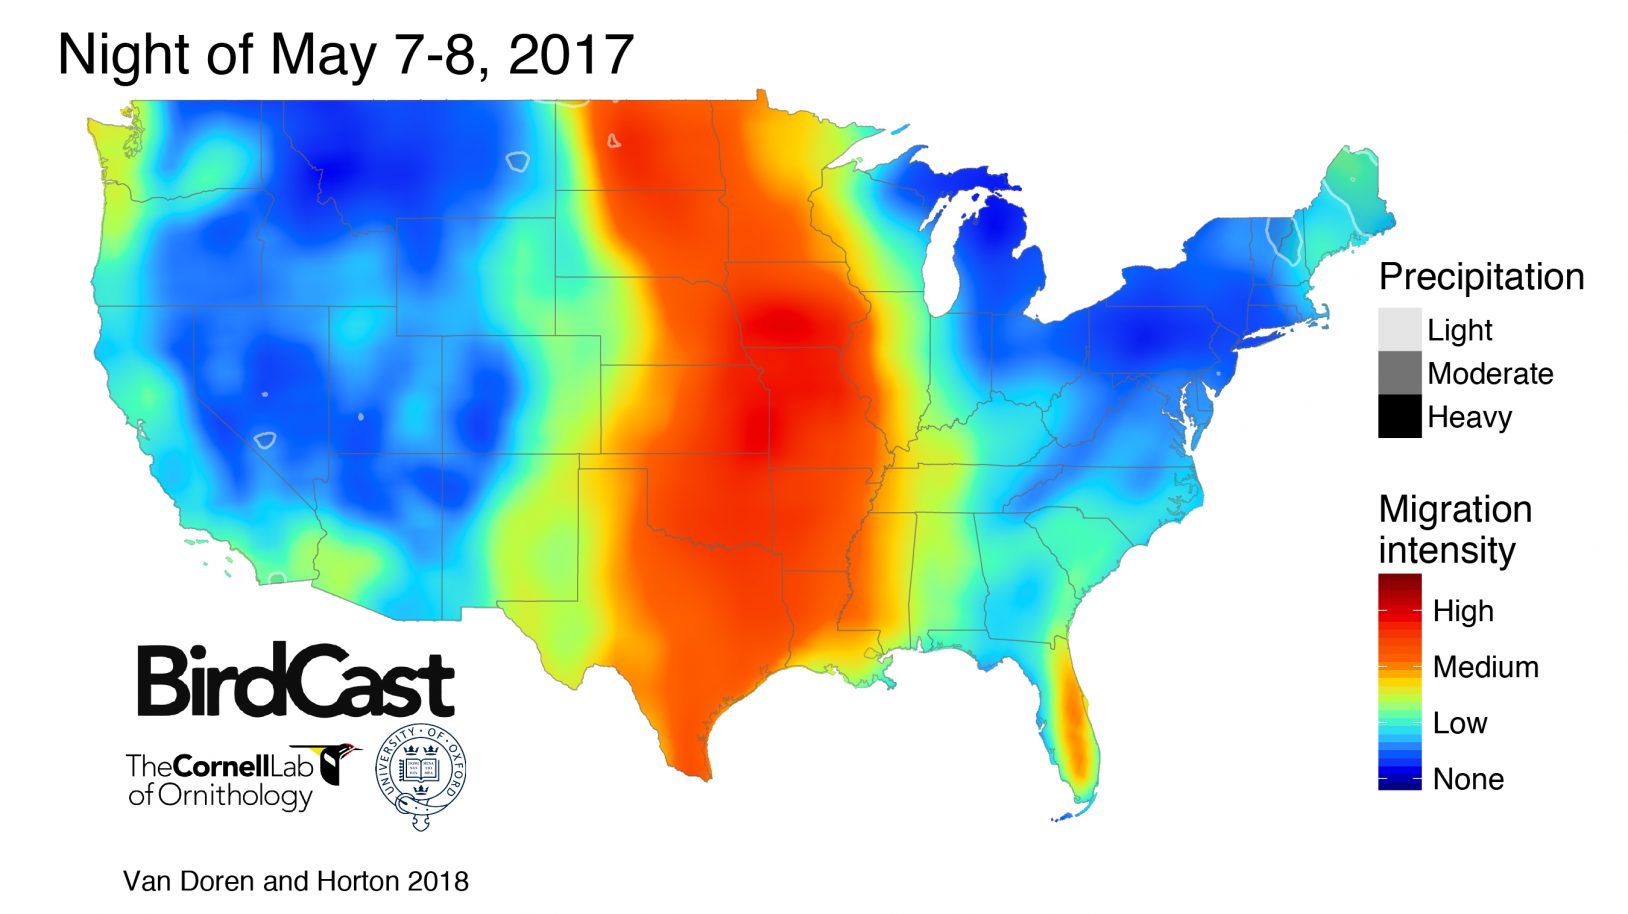
The live migration maps take data from 143 weather radars in the continental United States, which can detect birds in addition to various meteorological phenomena, and package them into maps that quantify the bird traffic. Each map packs a wealth of information, with shading showing migration traffic rates – the estimated number of birds migrating per hour across any given kilometer in the continental United States.
Additionally, arrows reveal the general direction in which birds’ movements are heading. Maps from sunset to about noon the following day are made into animation, generally showing how bird migration ramps up 30-45 minutes after sunset each night! This live map is updated every 10 minutes, every night, all season long.
“We’re able to isolate bird data from atmospheric information because of the way weather radar works—a process called dual-polarization,” explains Adriaan Dokter, who developed the live migration maps. “This means the radar stations transmit and receive radio waves in both vertical and horizontal directions. It provides a much clearer picture of the size, shape, and direction of the targets it picks up. And with the power of cloud computing, we can analyze all radar data incredibly fast.”
Most songbirds migrate in darkness, usually when weather conditions are favorable. Tailwinds can produce massive migratory movements. Rain can shut down flights entirely.
“Knowing when and where a large pulse of migrants will pass through is useful for conservation purposes,” says Benjamin Van Doren, a former Cornell undergraduate and now Ph.D. candidate at the University of Oxford. “Our forecasts could prompt temporary shutdowns of wind turbines or large sources of light pollution along the migration route. Both actions could significantly reduce bird mortality.”
“This is the most significant update since we first began using radar to study bird movements,” notes Cornell Lab postdoctoral associate, Kyle Horton. “From the bird watcher’s perspective, if you know where and when migrants will be flying at night, you stand a better chance of seeing them, especially if the birds make a stopover in your area.”
Van Doren and Horton designed the system that generates the migration forecast maps. They used machine learning models based on 23 years of radar and weather data to predict suitable conditions for migration occurring three hours after local sunset.
“These forecast and live migration maps, and the research that produced them, represent a breakthrough nearly 20 years in the making,” adds Cornell Lab migration researcher Andrew Farnsworth. “We hope these maps will provide perspective to the expert and novice alike on the amazing spectacle—and the sheer magnitude—of migration. Beyond that, we believe these maps will become powerful tools for conservation action to help reduce the impacts of human-made hazards birds face during their incredible journeys.”
The new BirdCast features were unveiled early in spring migration 2018. They represent an area of active research.
For example, bird numbers are approximate. The real time migration maps estimate activity in thousands of birds per kilometer. These numbers are based on songbird-sized birds—it is possible that there could be smaller numbers of larger birds creating the same signal.
Additionally, radar cannot produce data to identify species. The maps can tell you when birds are moving but not which birds are moving. Furthermore, flight direction is sometimes incorrect, useful as a general indication rather than a precise measurement of the movement of birds in the atmosphere.
All indications so far suggest that the forecasts are effectively predicting migration events. And by creating accurate forecasts and up-to-the-minute monitoring tools, the team hopes to provide tools for managing wind turbines and city lights. Collisions with lighted windows (and, to a lesser extent, wind turbines) are a major cause of bird death. But the majority of migrants come through on a few nights each year, meaning that fairly minor, temporary adjustments could save huge numbers of birds.
Note, these maps are currently limited in their coverage to the continental United States. Radar collection and processing infrastructure and the real-time data connections are currently unavailable outside of this region.
Submitted by Miyoko Chu on behalf of the Cornell Lab of Ornithology
This research was supported by funding from the National Science Foundation, Leon Levy Foundation, and NASA. Additional funding was provided by the Edward W. Rose Postdoctoral Fellowship at the Cornell Lab of Ornithology, Marshall Aid Commemoration Commission in the United Kingdom, and Amazon Web Services Cloud Credits for Research. The BirdCast project is a collaboration among the Cornell Lab of Ornithology, University of Massachusetts Amherst, and Oregon State University, and was funded by grants from the National Science Foundation and Leon Levy Foundation.